Assigning number grades to third graders’ work has always been challenging for me. I want to reward effort and progress, although I know the grade is meant to represent the level of mastery. I want my students to continue pushing themselves, even if they earn straight A’s. In our district, like many others I assume, we are working towards “standards-based grading.” The idea is that the grades truly represent the child’s ability to show mastery of important standards. To add to the challenge, I’ve also realized that both students and parents have difficulty interpreting the meaning of grades.
Earlier this year, I sat down with one of my kiddos to go over his recent math test. The score was written on the front in green marker. It was a 65.
“Did I do good?” the student asked hopefully after looking at the grade.
I get this question from students far too often and I’m not sure why it took me so long to do something about it. Why did I assume that kids understand the meaning of a number grade, or even a letter grade for that matter?
Along with the kids, many parents have trouble interpreting grades. And rightly so. I remember one student who had been earning B’s and C’s all year. In my eyes, this was a clear message to parents that the child was struggling. When we met for a parent conference, the mom said to me, “But she was passing so I thought she was doing okay.” Good point!
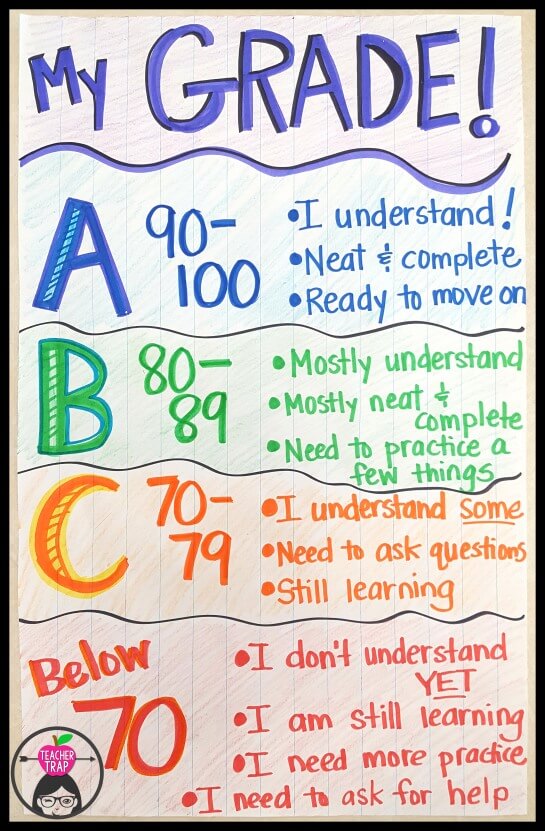
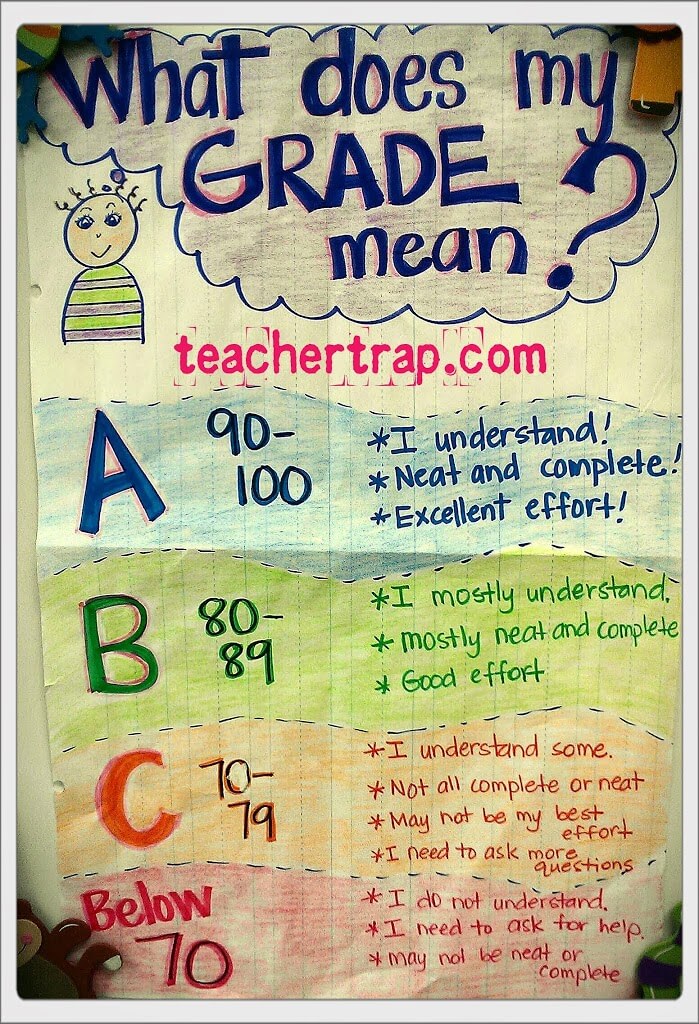
This year, I decided to make more of an effort to help students understand both the purpose and meaning of grades. My first step was creating a general breakdown of grades. I shared this anchor chart with the kids and we discussed what each grade means.
Obviously, this chart does not provide clear and detailed explanations of each grade, but my goal was simply to give students a jumping off point. This chart helps kids see the “big picture.” I want my class to understand that an “A” shows mastery of the skills, but that getting “A’s” usually requires a little extra effort on top of that! I’ve been so frustrated with students who fly through a math test and make silly errors, even though I know they are capable of doing the work. The grade a student earns is directly related to their ability to SHOW what they know.
Next, to help students apply this grading scale across the board, we made grading charts for everything! We created a chart for “being a good partner,” “being a good reader,” being a good student,” and whatever else came up. Then we used those charts to rate ourselves on different activities throughout the day.
Not only did this turn out to be a great classroom management and self-reflection piece, but my kids now understand the meaning of the letter and number grades they see on their work and report cards. I also include a copy of the grading chart in my students’ Take-Home Binders so that parents can use it, too.
The chart has also been helpful for goal-setting. For example, if a student scored a C on a math test, then their goal might be to earn a B on the next one. This helps me get the kids focused on PROGRESS rather than just ACHIEVEMENT.
The chart works wonderfully in combination with rubrics specific to different projects and tasks. I can help students understand the detailed goals of project, while still helping them understand their overall level of mastery.
I’m always surprised at how many things I assume kids know and understand… And we all know what happens when you assume. 🙂
I’d love to hear of other ideas or ways of helping kids understand their progress and achievement within such a subjective grading system.
UPDATE: I felt like the descriptors on my original chart were missing a little something, so when I made it for my class this year, I revised a few parts. Here is the updated version:


